Peering into the financial heart of a company might seem daunting at first, but it is a crucial step for anyone interested in investing. By learning how to read a financial statement, you gain the power to make powerful decisions about which stocks to buy, which to pass on, and how to strategize your financial future.
Let us simplify this process and uncover the financial statements like a pro. Whether you are planning your first investment or looking to refine your strategies, understanding these documents is your starting point.
What Is a Financial Statement?

A financial statement is a formal record of the financial activities of a business, entity, or person. Analyzing these documents can help you understand the financial status of a company at a particular point in time and over a period. These statements consist mainly of the balance sheet, income statement, and cash flow statement. Each plays a pivotal role in offering insights into various aspects of the company’s financial health.
Time to have a look at each of them!
The Balance Sheet
A balance sheet captures a company’s financial position at a particular moment, detailing its assets, liabilities, and equity. The assets section covers things like cash, investments, property, and equipment, while liabilities encompass debts, loans, and other financial commitments. Equity is the remaining interest in the company’s assets once you subtract the liabilities.
Assets are in a list – in order of liquidity, with the most liquid assets listed first. Liquid assets are those users can easily convert to cash, such as cash and marketable securities. Less liquid assets, such as property and equipment, have a place in the later part of balance sheet.
Liabilities have a list – in order of maturity, with the most immediate liabilities listed first. Current liabilities are those that must be paid within one year, such as accounts payable and accrued expenses. Long-term liabilities are those that are due after one year, such as notes payable and long-term debt.
Equity represents the residual interest in the company’s assets after deducting liabilities. Equity includes common stock, preferred stock, and retained earnings.
Retained earnings represent the portion of a company’s profits that have been reinvested in the business rather than distributed to shareholders as dividends.
Here’s what a balance sheet looks like:
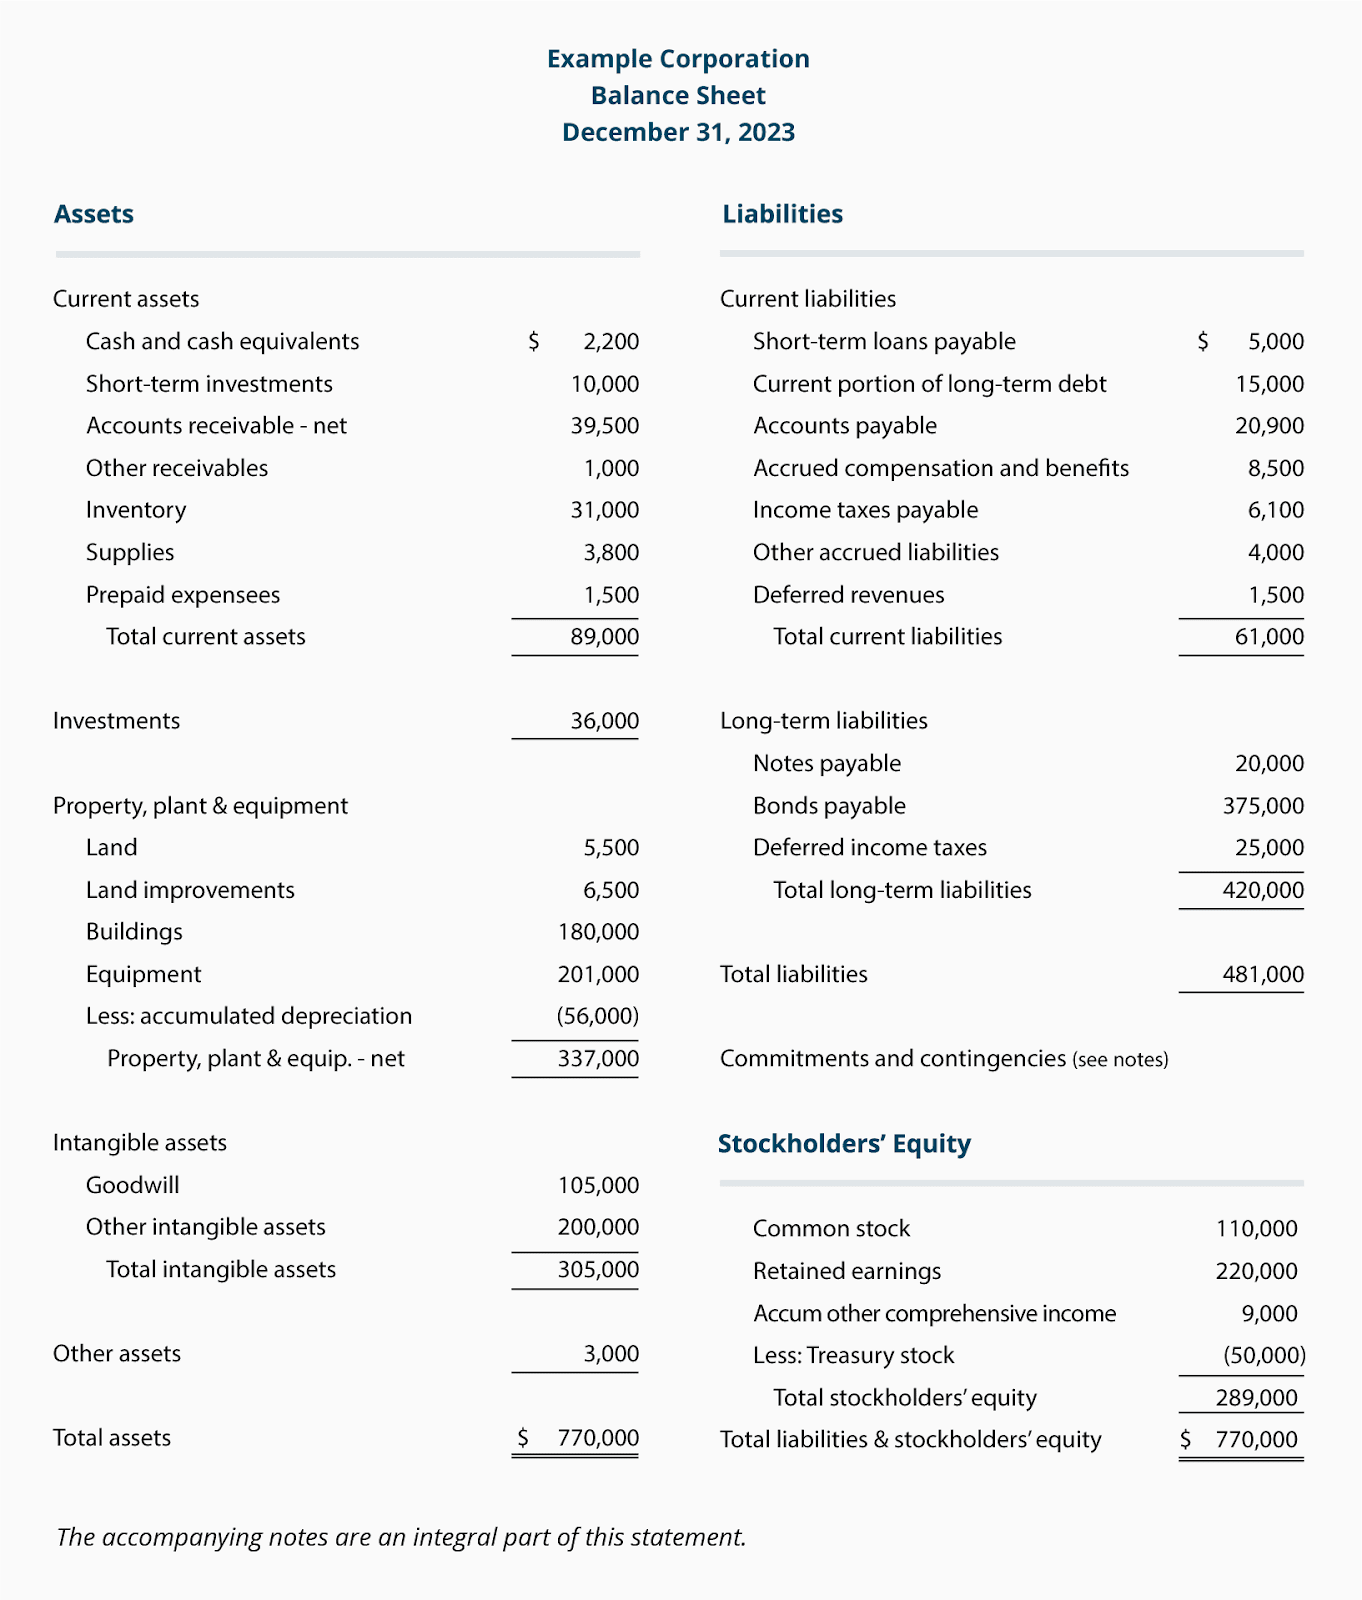
The balance sheet is typically used to calculate financial ratios such as the current ratio and debt-to-equity ratio, which provide information about a company’s liquidity and solvency.
The Income Statement
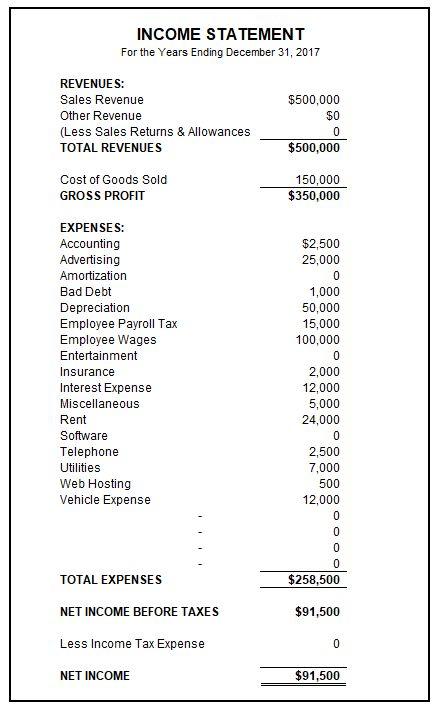
The income statement, also known as the profit and loss statement, shows a company’s revenues and expenses over a specific period of time and is crucial for evaluating a company’s financial performance.
Operating income, also known as EBIT (Earnings Before Interest and Taxes), refers to the profit earned from regular business operations before subtracting any non-operating income, non-operating expenses, interest, or taxes from revenues.
It provides information about a company’s profitability and operating efficiency. The income statement includes revenue, cost of goods sold, operating expenses, and net income.
Revenue represents the total amount of money that a company earns from the sale of its goods or services.
Cost of goods sold (COGS) represents the direct costs associated with producing the goods or services that a company sells.
Operating expenses include selling, general, and administrative expenses, such as salaries, rent, and utilities.
Net income represents the amount of money that a company earns after deducting all of its expenses. Net income is also referred to as earnings or profits.
The income statement is used to calculate financial ratios such as the gross profit margin and net profit margin, which provide a peek into a company’s profitability and efficiency.
This is what an income statement looks like:
The Cash Flow Statement
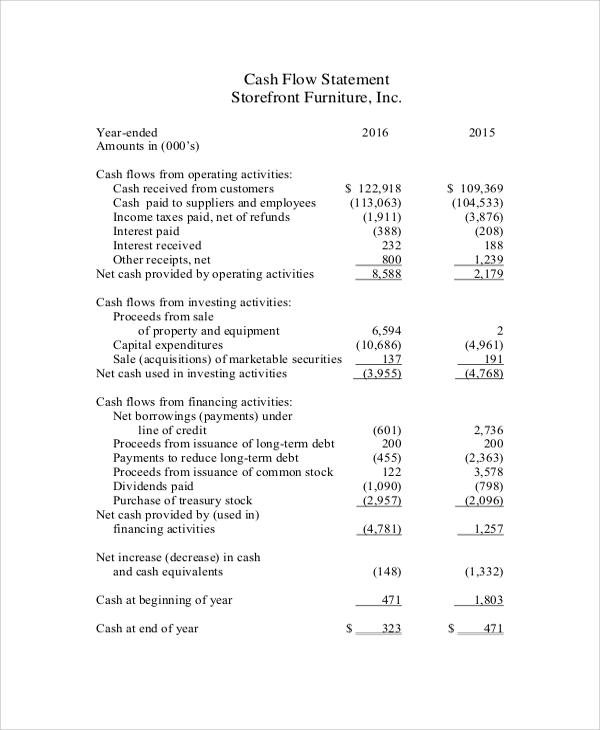
The cash flow statement exhibits a company’s cash inflows and outflows over a specific period of time. It provides information about a company’s ability to generate cash and manage its liquidity.
The cash flow statement includes cash flows from operating activities, investing activities, and financing activities.
Operating activities include cash inflows and outflows associated with a company’s core business operations. Such as cash received from customers and cash paid to suppliers.
Investing activities include cash inflows and outflows associated with the purchase and sale of long-term assets. Such as property, plant, and equipment.
Financing activities include cash inflows and outflows associated with the issuance and repayment of debt and equity. Such as the issuance of bonds and the payment of dividends.
The cash flow statement is used to calculate financial ratios such as the cash flow margin and cash flow to debt ratio.
Following is a sample of a cash flow statement of a company, Storefront Furniture, Inc. for the years ended 2015 and 2016.
Breaking Down Financial Statements
You must go beyond just reading financial statements and analyze them to discern trends and financial health:
- Vertical Analysis: This involves comparing different items on a single financial statement to a base figure such as total revenue or total assets. For instance, analyzing how each expense in the income statement relates to the total sales can reveal cost efficiencies or inefficiencies.
- Horizontal Analysis: This is used to analyze trends over several periods. By comparing financial data from different periods, investors can detect trends that may be improving or deteriorating, such as changes in revenue growth, expense management, or net income margins.
- Ratio Analysis: Ratios like return on equity, debt-to-equity, and current ratios stem from financial statements and can provide insights into a company’s profitability, efficiency, and liquidity. These ratios are critical for comparing a company’s performance against its peers or industry benchmarks.
- Comparative Analysis: This analysis involves comparing a company’s financial statements with those of other companies in the same industry. This comparison can provide a competitive edge by highlighting strengths and weaknesses relative to peers.
It is important to note that financial statements use generally accepted accounting principles (GAAP) or international financial reporting standards (IFRS). These principles provide a consistent framework for financial reporting, but they also allow for some flexibility. As a result, it is important to compare financial statements over time and against industry benchmarks to identify trends and anomalies.

Conclusion
As we wrap up, remember, that the ability to read and interpret financial statements is not just a skill but a tool that empowers you to make shrewd decisions and spot opportunities where others might see mere numbers. Keep practicing and stay curious to build a stronger, more insightful investment strategy. Whether you are assessing a new company for the first time or revisiting the financials of familiar stocks, your newfound skills will serve you well in the pursuit of your financial goals.