
Grasping the concepts of technical analysis is essential for anyone looking to succeed in trading and investing.
The tech analysis elements enable traders to interpret stock charts and predict future price movements effectively. In this article, we will discuss different types of stock chart patterns, helping you to not just spot them but also understand what they are denoting. We will also overview the nature of market trends and momentum trading, explore what are support & resistance levels, and dissect the leading technical indicators.
What Exactly Are Chart Patterns?
Chart patterns are visual representations of an asset’s price and movements over time. They are formed by the interaction of buyers and sellers in the market and can be identified by their unique shapes and formations. By recognizing these patterns, traders can gain insights into the market’s behavior and make informed decisions based on historical data.
There are many different types of chart patterns, each with its own unique characteristics and implications. Some patterns indicate a continuation of the current trend, while others suggest a reversal of the trend.
Popular Stock Chart Patterns
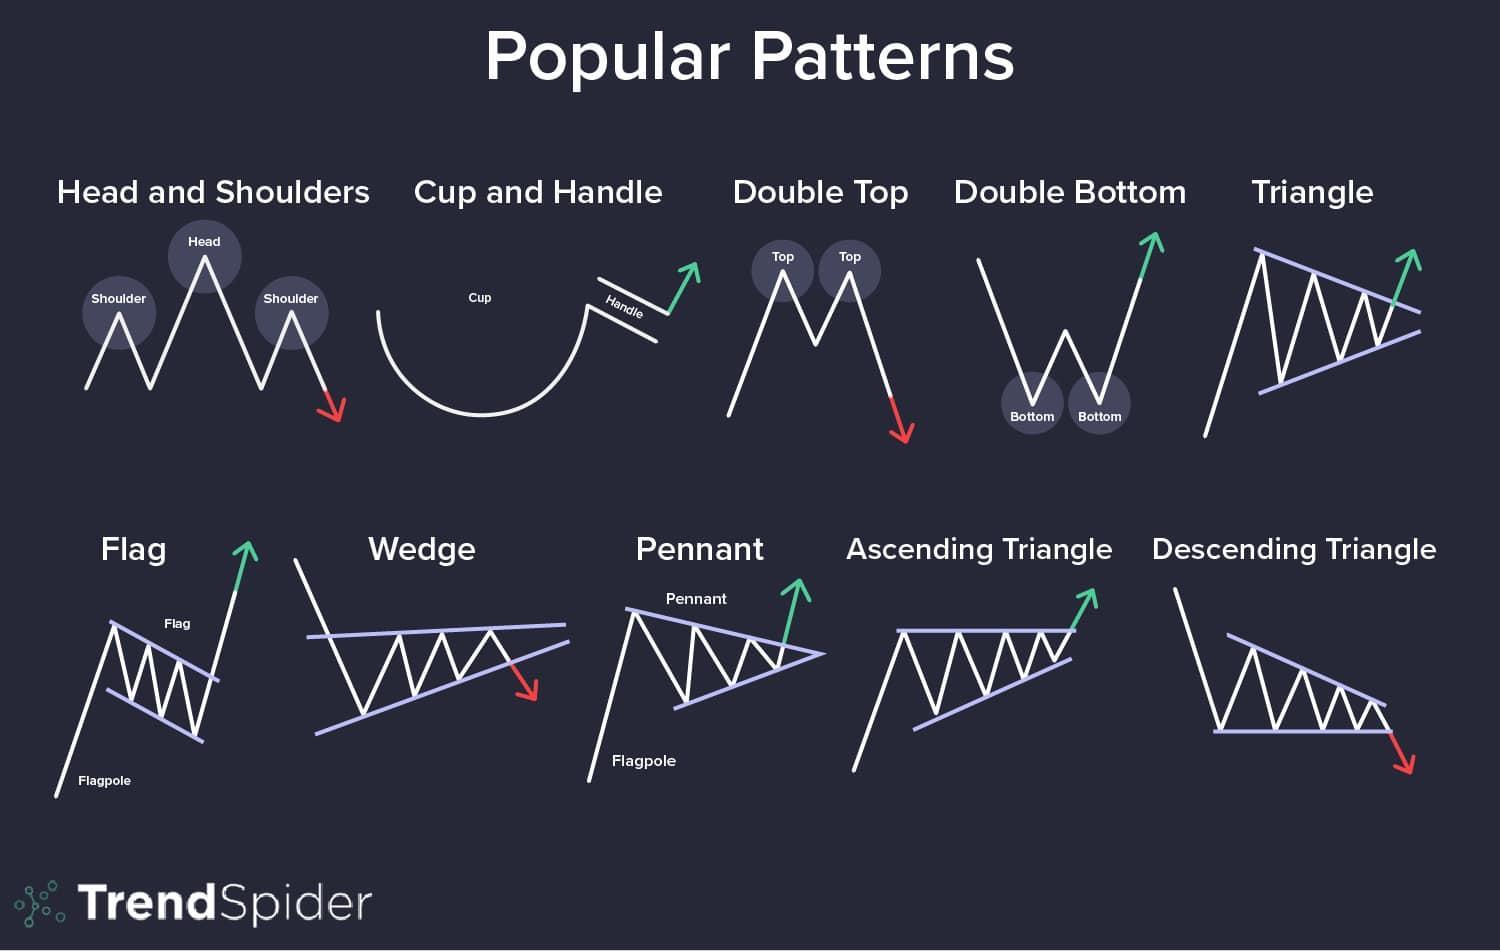
1. Head and Shoulders (Reversal Pattern)
Characteristics:
This pattern features two smaller peaks (shoulders) on either side of a larger peak (head). It signals a reversal of the prevailing trend and is considered one of the most reliable chart patterns. The ‘neckline’ is the support level formed by drawing a line connecting the lowest points of the two troughs.
Reading the Pattern:
A complete “head and shoulders” pattern signals that the upward trend is exhausted, and a reversal is imminent once the price breaks below the neckline. Traders often enter a short position following a break below the neckline, with the depth of the head from the neckline suggesting a potential drop in price.
The inverse head and shoulders point toward the end of a bearish trend.
2. Cup and Handle (Continuation Pattern)
Characteristics:
This stock chart pattern resembles a teacup, featuring a smooth, rounded bottom (the cup) and a small downward drift (the handle). It typically forms in an uptrend and suggests a continuation of the upward movement.
Reading the Pattern:
The key to trading the “cup and handle” pattern is to wait for the price breakout above the handle. The breakout is often accompanied by increased trading volume and indicates a buy signal for traders, with the depth of the cup suggesting the potential rise in price.
3. Triangles (Continuation/Reversal Pattern)
Symmetrical Triangle: Characterized by two converging trendlines with similar slopes, this pattern represents a period of consolidation before the next price action breaks out.
Ascending Triangle: Formed by a horizontal resistance line and an upward-sloping support line, it generally indicates accumulation and is typically bullish.
Descending Triangle: Features a horizontal support line and a downward-sloping resistance line, usually resulting in a bearish breakout.
Reading the Pattern:
For all triangles, the direction of the price breakout is critical and often follows the trend preceding the pattern. A breakout from the lower trendline in a descending triangle suggests selling, while a breakout above the upper trendline in an ascending triangle suggests buying. Volume should increase on the breakout to confirm the pattern’s validity.
4. Double Tops and Bottoms (Reversal Pattern)
Characteristics:
These stock market chart patterns signal a trend reversal. A double top is formed after the price reaches a high twice and declines between the two peaks; it is a bearish pattern. A double bottom, appearing after the price hits a low twice with a rise in between, is bullish.
Reading the Pattern:
A double top is confirmed when the price falls below the support level (valley floor) between the peaks, suggesting a sell signal. Conversely, a double bottom is confirmed when the price breaks above the resistance level (peak ceiling) between the lows, indicating a buy signal.
5. Flags and Pennants (Continuation Patterns)
Characteristics:
Both flags and pennants represent a series of brief pauses or consolidations after a significant price movement, followed by a continuation of the original trend. Flags are parallelogram-shaped and can slope against the trend, while pennants are small symmetrical triangles that form right after a steep price move.
Reading the Pattern:
For both flags and pennants, the key to trading is to recognize the consolidation following a strong price move. The breakout usually continues in the same direction as the initial trend. Traders often look for an increase in volume to confirm the breakout.
6. Wedges (Continuation/Reversal Pattern)
Characteristics:
Wedges are similar to triangles but have converging trendlines that move in the same direction. There are two types: rising and falling wedges. A rising wedge forms during an uptrend and signals a reversal when the price breaks downward. Conversely, a falling wedge occurs during a a downtrends and indicates a reversal with an upward price breakout.
Reading the Pattern:
The interpretation of a wedge depends on the trend context. For a rising wedge, traders typically prepare for a potential sell-off after the price breaks below the lower trendline. For a falling wedge, a break above the upper trendline can suggest a buying opportunity.
7. Triple Tops and Bottoms (Reversal Pattern)
Characteristics:
These stock chart patterns are extensions of the double top and bottom formations and are considered stronger and more reliable. A triple top includes three peaks at approximately the same price level and suggests a bearish reversal, while a triple bottom features three lows, indicating a bullish reversal.
Reading the Pattern:
For triple tops, a trader would consider taking a short position when the price falls below the support level defined by the lows between the peaks. For triple bottoms, the trader might take a long position when the price rises above the resistance defined by the highs between the lows.
8. Channel (Continuation Pattern)
Characteristics:
A channel is formed when the same price moves or is contained between two parallel trendlines. If the channel is moving upward, it’s an ascending channel; if downward, it’s a descending channel. Horizontal channels may also occur and are typically neutral.
Reading the Pattern:
Trading within a channel is about recognizing the upper and lower boundaries as potential points for reversals within the trend. Buying at the lower channel line (support) and selling at the upper channel line (resistance) can be an effective strategy. A breakout above or below a channel may indicate a stronger move in the direction of the breakout.
How to Best Interpret Chart Patterns
Interpreting stock market chart patterns requires a combination of technical and fundamental analysis and intuition. Here are some tips to help you interpret chart patterns:
- Look for Confirmation: Before making any decisions based on a chart pattern, look for confirmation. This can come in the form of a breakout or a confirmation signal, such as a moving average crossover.
- Technical analysis tools such as trendlines, the Relative Strength Index (RSI), and moving averages (MA) are popular among traders for evaluating market trends and determining support and resistance levels.
- Consider the Context: Chart patterns should be interpreted in the context of the overall market conditions. For example, a bullish chart pattern may not be valid in a bear market.
- Use Multiple Timeframes: Chart patterns can be analyzed on different timeframes, from intraday to monthly. By using multiple timeframes, you can get a more complete picture of the market’s behavior.
- Practice and Refine Your Skills: Interpreting chart patterns takes practice and experience. Start by analyzing historical data and refining your skills over time.
Understanding Market Trends and Momentum For Successful Trading
What Are Market Trends?
A market trend is the overall direction in which the market or the price of a particular asset is moving. Recognizing these trends is crucial for making informed trading decisions. There are three primary types of market trends:
1. Upward Trends (Bullish): These trends are characterized by rising prices. When the market is in an upward trend, it means that the demand for assets is higher than the supply, pushing prices up. Investors typically buy during an upward bull market trend with the expectation that prices will continue to rise.
2. Downward Trends (Bearish): Conversely, downward trends occur when prices are falling. This indicates that the supply of assets exceeds demand, leading to a decrease in prices. Traders might sell or short-sell in these conditions, aiming to buy back at a lower price.
3. Sideways Trends (Neutral): Sometimes, the market does not show a clear upward or downward movement. This is known as a sideways trend, where prices move within a narrow range. During these periods, traders often wait for a breakout in either direction before taking significant positions.
Understanding these market trends helps traders align their strategies with the market’s overall direction, increasing the likelihood of profitable trades.
What Is Momentum Trading?
Momentum trading is based on the premise that stocks with strong upward or downward momentum are likely to continue in that direction.
By identifying these trends early and entering trades accordingly, momentum traders aim to ride the wave of price movements and generate profits. The foundation of momentum trading lies in the belief that markets exhibit a certain degree of persistence in their behavior. When a stock experiences a significant price move, either up or down, it often continues in that direction for a period of time before reversing course.
Momentum trading involves capitalizing on the market’s current trend with the expectation that the trend will continue. Here’s how traders use momentum in their strategies:
1. Identifying Strong Trends: Momentum traders look for assets showing strong trends. This involves using various momentum indicators such as the Relative Strength Index (RSI), Moving Average Convergence Divergence (MACD), and the Average Directional Index (ADX). These tools help in determining the strength and sustainability of a trend.
2. Timing Entries and Exits: Effective momentum trading relies on precise timing. Traders enter positions when momentum indicators signal the beginning of a strong trend and exit when these indicators show signs of weakening momentum.
3. Risk Management: Because momentum trading involves riding the wave of a trend, it is crucial to have a robust risk management strategy. This includes setting stop-loss orders to limit potential losses and taking profits at predetermined levels.
Applying Technical Analysis to Market Trends and Momentum
Technical analysis involves studying historical price movements and patterns on stock charts to predict future movements. Here’s how traders use technical analysis to understand market trends and momentum:
Technical analysts rely on support and resistance levels to determine market psychology and supply and demand, and when these levels are broken, new levels of support and resistance are likely to be established.
- Trendlines and Chart Patterns: Drawing trendlines on stock charts helps in identifying the direction of the trend. Patterns such as head and shoulders, double tops, and double bottoms also provide valuable insights into potential trend reversals.
- Moving Averages: Moving averages smooth out price data to identify the direction of the trend more easily. The crossover of short-term and long-term moving averages is a common signal used by traders to identify trend changes.
- Volume Analysis: Volume, the number of shares traded during a given period, is a critical component of technical analysis. High volume during an upward trend indicates strong buying interest, reinforcing the bullish trend. Conversely, low volume during a trend can signal weakening momentum.
- Momentum Indicators: As mentioned earlier, indicators like RSI, MACD, and ADX are vital tools. For instance, RSI measures the speed and change of price movements, helping traders identify overbought or oversold conditions. MACD, which shows the relationship between two moving averages, helps in identifying changes in the strength, direction, momentum, and duration of a trend.
Practical Tips for Momentum and Trend Trading
To effectively trade using market trends and momentum, consider the following tips:
- Stay Informed: Regularly monitor financial news and market analysis to stay informed about factors that might influence market trends. This includes economic reports, earnings announcements, and geopolitical events.
- Backtesting: Before applying any trading strategy, use historical data to backtest it. This helps in understanding how the strategy would have performed in the past, providing insights into its potential effectiveness.
- Diversification: Don’t put all your eggs in one basket. Diversify your portfolio to spread risk. Momentum trading can be applied to various asset classes, including stocks, commodities, and currencies.
- Continuous Learning: The markets are always evolving. Continuous learning and adapting to new market conditions and trading strategies are essential for long-term success.
- Psychological Discipline: Trading can be emotionally challenging. Maintain discipline by sticking to your trading plan, and don’t let emotions drive your decisions.
- Be Patient: Trading requires patience. Trends can last for weeks, months, or even years, and it’s important to give your trades time to play out. Avoid the temptation to exit trades too early, and trust your analysis and strategy.
- Use Multiple Time Frames: Analyzing multiple time frames can provide a clearer picture of the market dynamics. For example, if you are trading on a daily chart, also look at the weekly and monthly charts to understand the broader trend. This multi-timeframe analysis can help you make more informed decisions.
- Adjust Your Strategy: Market conditions change, and trends can shift. Be prepared to adjust your strategy if necessary. Stay flexible and be willing to adapt to new market conditions to stay ahead of the curve.
Identifying Support and Resistance Levels: Why They Are Vital For Technical Analysis
Now let’s look into a topic that is crucial for anyone venturing into the world of trading support and resistance levels. These terms might sound a bit technical, but understanding them can make a huge difference in how you interpret market movements and make trading decisions.
The significance of a support or resistance level increases with the number of times the price tests it, influencing trading decisions.
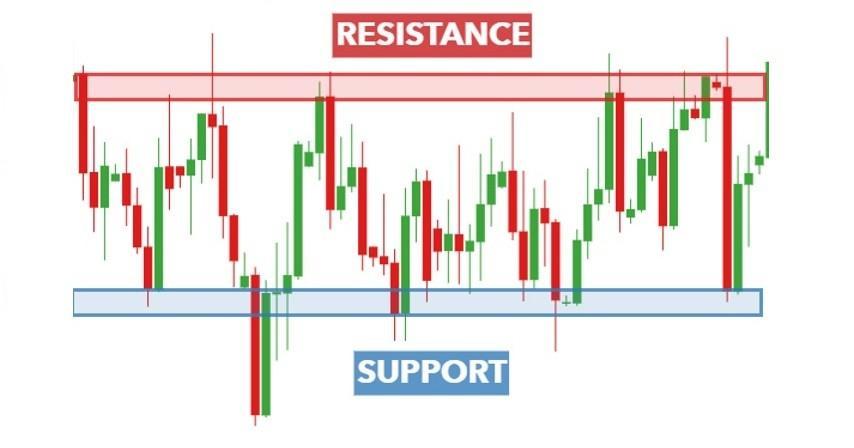
What Are Support and Resistance Levels?
First off, let’s clarify what support and resistance levels are. When you are looking at a chart that shows the price movements of a stock or any other asset over time, you will notice that prices don’t just move in straight lines; they go up and down, forming patterns.
- Support is a price level where a downtrend can be expected to pause due to a concentration of demand. In other words, it’s where the price tends to find support as it falls.
- Resistance is a price level where an uptrend can be expected to pause due to a concentration of selling. Essentially, it’s where the price tends to hit a ceiling as it rises.
These levels are not set in stone. They can shift based on various factors, but they are essential for predicting price movements and making better trading decisions.
Why Are Support and Resistance Levels Important?
Understanding support and resistance is crucial because these levels can help you predict future price movements. When you know where these levels are, you can better decide when to enter or exit a trade. This can help you maximize your profits and minimize your losses.
For instance, if you identify a strong support level, you might decide it’s a good time to buy, expecting that the price will not fall much further. Conversely, if you see a strong resistance level, you might decide it’s a good time to sell, anticipating that the price will not go much higher.
How to Identify Support Levels
Let’s start with how to identify a support level. These are typically found by looking at past price movements. Here are a few methods to spot them:
- Historical Price Data: Look at a chart and identify the lowest points the price has reached and bounced back from. These points are your potential support levels.
- Moving Averages: Sometimes, moving averages can act as support levels. For example, the 50-day or 200-day moving average often serves as a dynamic support.
- Volume Analysis: When you see high trading volume at a particular price level, it can indicate strong support because a lot of traders are willing to buy at that price.
How to Identify Resistance Levels
Now, let’s talk about identifying resistance zones. These are the points where the price tends to stop rising and might start falling. Here are some common methods to find them:
- Historical Price Data: Just like with support, look at past price movements and identify the highest points the price has reached and then fallen from. These points are your potential resistance levels.
- Trend Lines: Drawing a line connecting the high points on a price chart can help identify a resistance trend line. This line can act as a barrier that the price struggles to break through.
- Volume Analysis: High trading volume at a particular price level can also indicate strong resistance, as many traders are willing to sell at that price.
Combining Support and Resistance Levels
A powerful strategy involves using both these levels together. By understanding where support and resistance are, you can predict potential breakout points.
For instance, if the price is approaching a resistance/supply level, it might either break through, indicating a potential buy signal, or it might bounce back down, suggesting a sell signal. Conversely, if the price is nearing a support level, it might bounce back up, indicating a buy signal, or break down through the support, suggesting a sell signal.
To help identify support and resistance areas, there are various tools and resources available:
- Charting Software: Platforms like TradingView or MetaTrader offer features to easily draw and identify these levels.
- Indicators: Some indicators, like Fibonacci retracement levels, can help identify potential support and resistance areas.
- Educational Resources: Websites, courses, and forums dedicated to trading often provide valuable insights and tips on identifying and using support and resistance levels.
Consider The Psychological Factors
It is also essential to consider the psychological aspect of support/resistance levels. Traders’ behavior often reinforces these zones. When many traders see a price approaching a known support or resistance level, they might act in a way that reinforces that area. For example, if traders believe that the price will bounce back up from a support level, they’ll buy, causing the price to rise, which in turn reinforces the support.
Practical Example
Let’s go through a practical example to solidify this concept. Consider a stock that has historically found support at $50 and resistance at $70. Knowing the stock is currently trading at $55, these levels can guide your trading decisions.
– If the price drops to $50, you might consider buying, expecting the support to hold.
– If the price rises to $70, you might consider selling, expecting the resistance to hold.
But remember, these levels are not foolproof. They can break, and when they do, it often leads to significant price movements.
Common Mistakes to Avoid
While support and resistance levels are valuable tools, there are common mistakes traders make:
1. Ignoring Other Indicators: Don’t rely solely on these levels. Use them in conjunction with other technical indicators for better accuracy.
2. Not Adjusting Levels: Support and resistance levels can change over time. Make sure to adjust your levels based on recent price movements.
3. Overcomplicating the Chart: Too many lines and indicators can make your chart confusing. Keep it simple and focus on the most significant support and resistance lines and areas.
Using Technical Indicators For Market Analysis
What are Technical Indicators?
Technical indicators are tools used to interpret stock market data and predict future price movements. They are derived from historical data such as price, volume, and open interest, and are plotted on trading charts to provide visual representations of market trends and patterns.
Let us look at some of the famous indicators and how to use them.
8 Popular Technical Indicators
Moving Averages
Moving Averages are one of the most widely used technical indicators in technical analysis. They smooth out price data to create a single flowing line, making it easier to identify the direction of the trend. The two main types are Simple Moving Average (SMA) and Exponential Moving Average (EMA).
- Simple Moving Average (SMA): It is the average of a set of prices over a specific number of days. For example, a 50-day SMA sums the closing prices of the last 50 days and divides by 50. Traders use SMA to identify overall trends. If the current price is above the 50-day SMA, it indicates an uptrend and vice versa.
- Exponential Moving Average (EMA): It gives more weight to recent prices, making it more responsive to new information. Traders often use the 21-day and 50-day EMA for short-term analysis.
How to Use Moving Averages:
Trend Identification: When the price is above the moving average, it indicates an uptrend. Conversely, when the price is below the moving average, it suggests a downtrend.
Support and Resistance: Moving averages can act as support or resistance levels. Prices often bounce off these levels, providing potential entry or exit points.
Relative Strength Index (RSI)
The Relative Strength Index (RSI) is a momentum oscillator that measures the speed and change of price movements. It ranges from 0 to 100 and helps identify overbought or oversold conditions.
How to Use RSI:
Overbought and Oversold Conditions: An RSI above 70 indicates that the asset may be overbought, while an RSI below 30 suggests it may be oversold. These conditions can signal potential reversals.
Divergences: When the price makes a new high or low that is not confirmed by the RSI, it often indicates a reversal. For example, if the price reaches a new high but the RSI forms a lower high, it signals a bearish divergence and an impending downside reversal.
MACD (Moving Average Convergence Divergence)
MACD shows the relationship between two moving averages of a security’s price. The MACD indicator comprises three components:
- MACD Line: The difference between the 12-day EMA and the 26-day EMA.
- Signal Line: A 9-day EMA of the MACD line.
- Histogram: The difference between the MACD line and the signal line.
How to Use MACD:
MACD Line and Signal Line Crossovers: When the MACD line crosses above the signal line, it generates a bullish signal. Conversely, when the MACD line crosses below the signal line, it generates a bearish signal.
Histogram: The histogram represents the difference between the MACD line and the signal line. Positive values indicate bullish momentum, while negative values indicate bearish momentum.
Bollinger Bands
Bollinger Bands consist of a middle band (usually a 20-day SMA) and two outer bands that are two standard deviations away from the middle band. They help measure market volatility.
How to Use Bollinger Bands:
Volatility Identification: When the bands are wide apart, it indicates high volatility. When they are close together, it indicates low volatility.
Overbought and Oversold Conditions: Prices tend to bounce within the bands. When the price touches the upper band, it may be overbought. When it touches the lower band, it may be oversold.
Fibonacci Retracement
This tool uses horizontal lines to indicate areas of support or resistance at the key Fibonacci levels before the price continues in the original direction. They are drawn from a high point to a low point on a chart to predict the future direction of the price movement.
How to Use Fibonacci Retracement:
Identify Support and Resistance Levels: The key Fibonacci levels (23.6%, 38.2%, 50%, 61.8%, and 100%) help identify potential reversal levels.
Entry and Exit Points: Traders often use Fibonacci levels to find potential trade entry and exit points during a trend retracement.
Average True Range (ATR)
ATR measures market volatility by decomposing the entire range of an asset price for that period. It is a useful indicator for setting stop-loss levels.
For instance, If the ATR is high, it indicates higher market volatility, which might influence a trader’s decision on where to place stop-loss orders.
Stochastic Oscillator
This indicator compares a particular closing price to a range of prices over a certain period; it ranges from 0 to 100.
How to Use Stochastic Oscillator:
Overbought/Oversold: A reading above 80 indicates overbought conditions, while a reading below 20 indicates oversold conditions.
Divergences: Similar to the RSI, divergences between the stochastic oscillator and price can signal potential reversals.
On-Balance Volume (OBV)
OBV uses volume flow to predict changes in asset price. It helps traders to confirm the last price trend, or spot potential reversals based on volume changes.
For instance, a rising OBV suggests that the volume is increasing on up days, a sign of strong market sentiment.
Is It Beneficial To Combine Technical Indicators?
While individual technical indicators provide valuable insights, combining multiple indicators can enhance the accuracy of technical analysis.
Examples of Effective Combinations
- RSI and MACD: RSI can indicate overbought or oversold conditions, while MACD can confirm the trend’s strength and direction. If RSI shows an oversold condition and MACD gives a bullish crossover, it can be a strong buy signal.
- Moving Averages and Bollinger Bands: Using moving averages to determine the trend and Bollinger Bands to find entry and exit points can be effective.
Using Technical Indicators: Some Practical Tips for Traders
1. Backtest your strategy using historical data to see how well it performs. This can help you understand how your indicators work under different market conditions.
2. Combine multiple indicators to reduce the risk of false signals. For example, use moving averages to identify the trend and RSI to pinpoint entry points.
3. Stay updated with market news and events as they can impact the effectiveness of technical indicators. Economic announcements, earnings reports, and geopolitical events can all influence market behavior.
Bottom Line
Think of technical analysis as your own personal market compass. It does not guarantee a smooth journey, but it will point you in the right direction, highlighting potential support and resistance levels, pinpointing buying and selling pressures, and even gauging market momentum. This knowledge can empower you to ace the ever-shifting tides of the market with greater confidence.